Is the Market Ready for a Breakout? Insights from the FED and Bond Market
As the crypto market anticipates potential breakout opportunities, attention is focused on this week’s crucial FED announcements and bond market trends. Could this mark the momentum shift needed to push BTC higher? Let’s break down the analysis to see how these developments might influence the market.
Post Feature Image
With potential breakout opportunities on the horizon, the crypto market is watching closely as key FED data and bond market trends unfold this week. Could this finally be the push that propels BTC upward? Let’s explore the analysis to understand how these shifts might impact the broader market.
In today’s update, we’ll cover:
- Key FED data and its potential impact on the market
- Bond market trends and how they could influence risk assets like crypto
- Updates on TradFi and crypto charts hinting at possible breakouts
- Cryptomindz’s take on the market’s next moves
Brace yourself for a significant market shift!
Disclaimer: This is not financial or investment advice. All investment decisions are your responsibility, and you bear the risk for any financial outcomes.
This Week’s Data
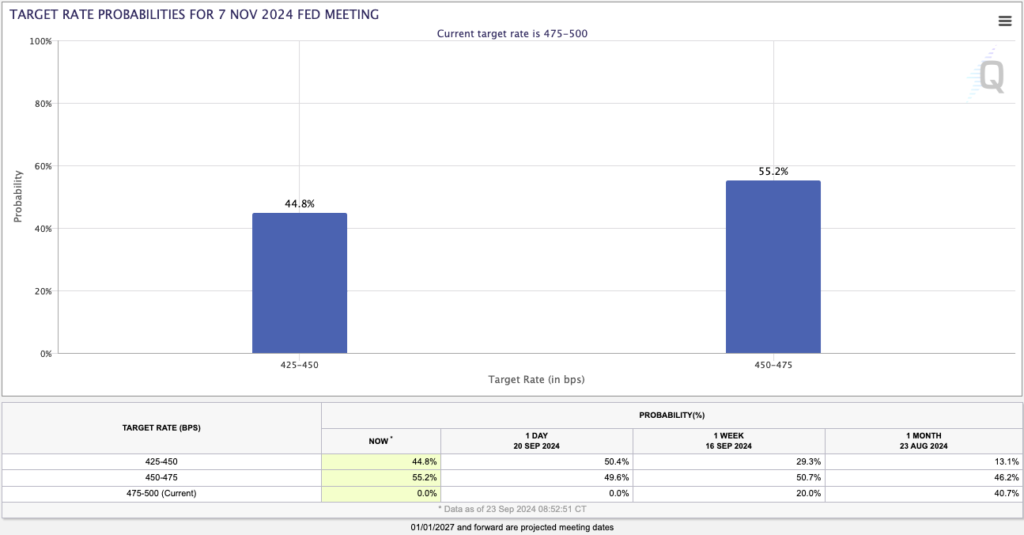
This week, there’s a flood of FED commentary, with Chair Powell’s statement on Thursday taking center stage. Market participants will be looking for clues on whether the FED might be leaning towards a 50bps rate hike at the November meeting. Most FED members are currently favoring a smaller 25bps hike, but they won’t commit until more data is available. The upcoming data releases over the next five weeks will be crucial in shaping their decision. At the moment, there’s a 55% chance the market is pricing in a 25bps rate cut.
Target Rate Probabilities for November 7th FED Meeting:

In addition to FED commentary, we’ve got Jobless Claims and GDP data landing on Thursday, followed by Personal Income and Spending figures on Friday.
The GDP growth rate is expected to hit a robust 3.0%, while Jobless Claims are forecasted around 226k. If these numbers align with predictions, risk assets could continue gaining strength, as the “soft landing” narrative stays intact. Friday’s data, with Personal Income and Spending both expected at 0.3%, would signal that consumers are still earning and spending, further supporting the soft landing outlook.
If this positive data comes through as expected, risk assets, including crypto, could maintain their upward trajectory.
Bond Market Dynamics
The bond market, often considered a key indicator of broader economic trends, is important to watch. Since May, bonds have been rallying in price while yields have dropped. This signals that the bond market has been anticipating a cycle of interest rate cuts. Investors have been buying bonds to lock in higher yields before they decline further.
When interest rate cuts begin, bonds become less attractive as yields fall, leading investors to seek higher-performing assets, such as stocks or riskier assets like crypto. Although yields have been dropping for months, there may still be some downside left, which could further benefit stocks and crypto by driving investors toward these risk assets.
If this downtrend in yields continues, it could provide a strong tailwind for both equities and crypto, potentially fueling a multi-month rally.
TradFi and Crypto Index Charts
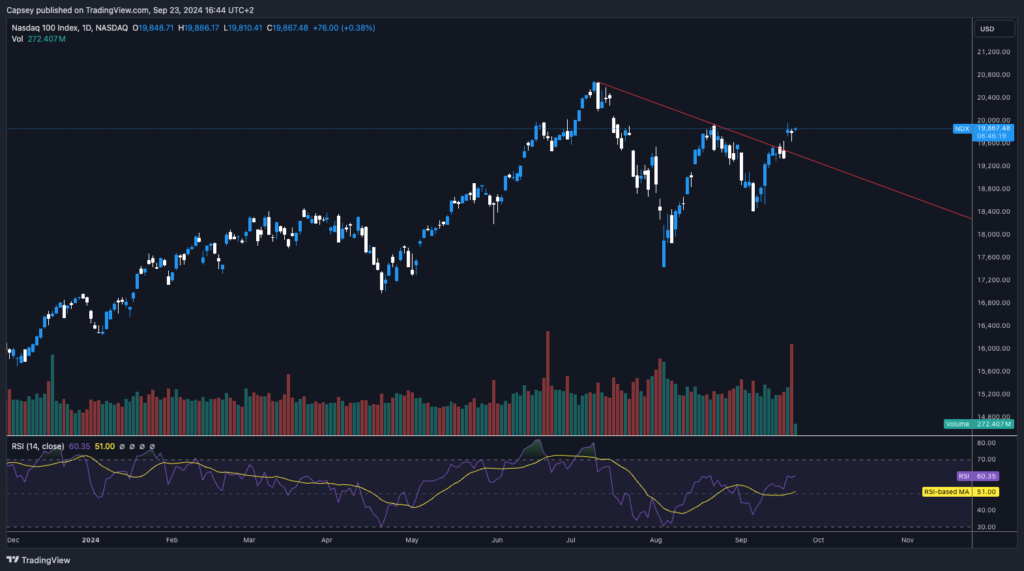
Next, we’re examining the Nasdaq (the TradFi chart) and Total 3 (the Crypto chart). Bitcoin has shown a loose correlation with the Nasdaq, making it a useful indicator for crypto trends.
Towards the end of last week, the Nasdaq broke through its downtrend, suggesting a potential rally toward all-time highs in the coming weeks. This would be a positive signal for crypto as well.
Nasdaq 1D Chart:

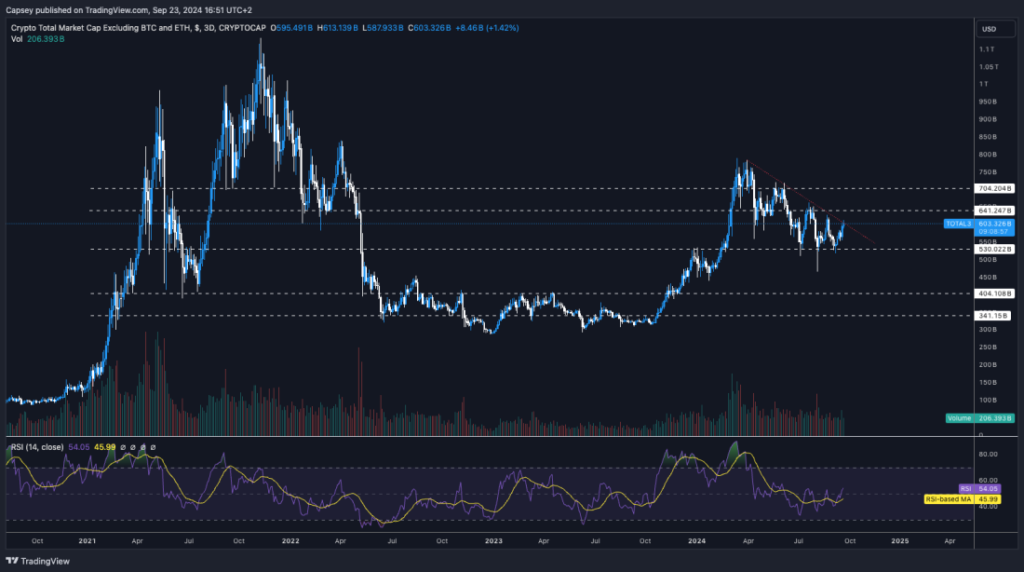
Looking at Total 3, which measures the total crypto market cap excluding Bitcoin and Ethereum, we get a clearer view of the broader market’s performance.
The Total 3 chart (in the 3D timeframe) shows that after hitting a high in Q1, the market pulled back and has been consolidating since. Price is now approaching a key downtrend line, and a clean breakout could push Total 3 up to $704 billion within the next six weeks. Overall, this chart looks quite bullish over the next two to four quarters.
Total 3 3D Chart:

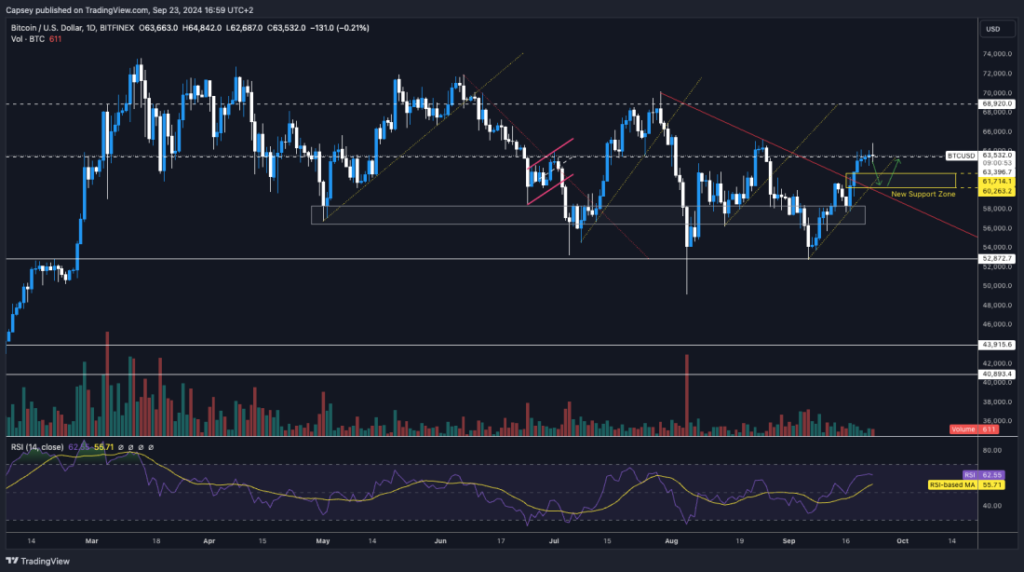
We’ll provide a more detailed Bitcoin update tomorrow in our Market Direction segment. For now, we see that Bitcoin has shown strong performance. While BTC hasn’t fully broken out of its downtrend, it has remained resilient without any major pullbacks. Currently, it’s battling resistance at the $63,400 level.
There’s potential for BTC to pull back to $61k, where there’s strong bid liquidity. On the upside, liquidity at $65k could push the price up by a few more percent in the short term.
BTC Chart:

Cryptomindz’s Take
In summary, the market can continue to grind higher as long as the soft landing narrative remains intact. For now, we are closely monitoring economic data to ensure it supports this outlook. However, with the upcoming election on the horizon, risk appetite may remain tempered until after the event.
We are sticking with our current barbell portfolio strategy for now, though we’re becoming more optimistic about the potential opportunities the market may present in the coming months. It feels like we’re on the brink of a significant expansion phase, which could see prices surge.

